
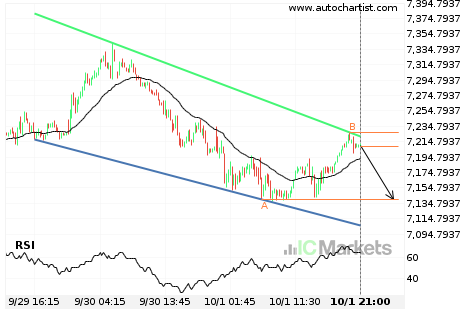
Australia 200 Index approaching support of a Channel Down
Australia 200 Index is approaching the support line of a Channel Down. It has touched this line numerous times in the last 3 days. If it tests this line again, it should do so in the next 15 hours.
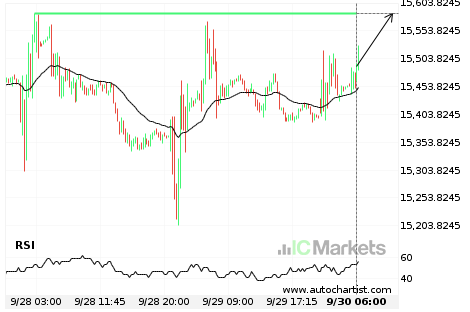
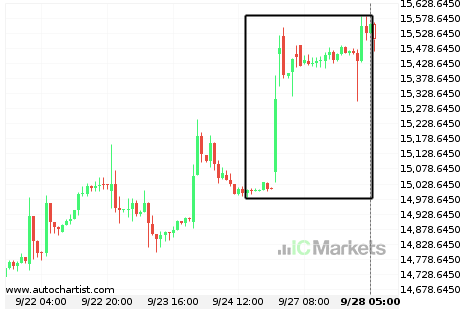
Either a rebound or a breakout imminent on FTSE China A50 Index
FTSE China A50 Index is heading towards a line of 15584.8096. If this movement continues, we expect the price of FTSE China A50 Index to test 15584.8096 within the next 10 hours. But don’t be so quick to trade, it has tested this line numerous times in the past, so this movement could be short-lived […]

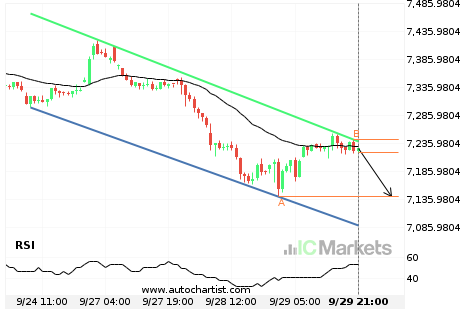
Australia 200 Index approaching support of a Channel Down
Australia 200 Index is approaching the support line of a Channel Down. It has touched this line numerous times in the last 6 days. If it tests this line again, it should do so in the next 2 days.
Australia 200 Index approaching support of a Channel Down
Australia 200 Index is approaching the support line of a Channel Down. It has touched this line numerous times in the last 6 days. If it tests this line again, it should do so in the next 2 days.
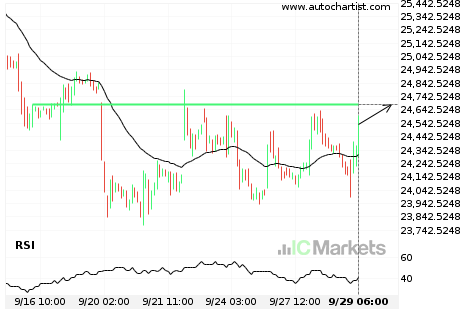
Either a rebound or a breakout imminent on Hong Kong 50 Index
Hong Kong 50 Index is heading towards a line of 24684.0000. If this movement continues, we expect the price of Hong Kong 50 Index to test 24684.0000 within the next 2 days. But don’t be so quick to trade, it has tested this line numerous times in the past, so this movement could be short-lived […]
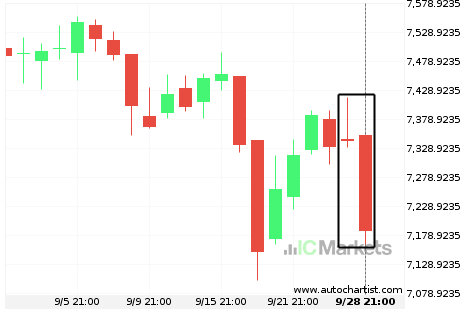
What’s going on with Australia 200 Index?
Those of you that are trend followers are probably eagerly watching Australia 200 Index to see if its latest 2.13% move continues. If not, the mean-reversion people out there will be delighted to cash in on this exceptionally large 3 days move.

What’s going on with Australia 200 Index?
Those of you that are trend followers are probably eagerly watching Australia 200 Index to see if its latest 2.13% move continues. If not, the mean-reversion people out there will be delighted to cash in on this exceptionally large 3 days move.
What’s going on with FTSE China A50 Index?
Those of you that are trend followers are probably eagerly watching FTSE China A50 Index to see if its latest 3.65% move continues. If not, the mean-reversion people out there will be delighted to cash in on this exceptionally large 4 days move.
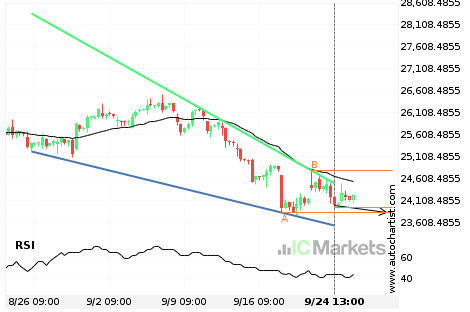
Breach of support line imminent by Hong Kong 50 Index
Hong Kong 50 Index is moving towards the support line of a Falling Wedge which it has tested numerous times in the past. We have seen it retrace from this line before, so at this stage it isn’t clear whether it will breach this line or rebound as it did before. If Hong Kong 50 […]